How to create and review infographics in under 30 minutes?
Infographics are the most effective way to communicate visually!
Visual content has become increasingly important to capture your audience's attention. And what better way to convey complex data than through an engaging and eye-catching infographic?
After all, infographics are:
- Easy to comprehend
- Likelier to grab the attention of your audience
- Breaks complex information into simple pieces
- Packed with research
- Fun to create! (We can all agree on this one)
This is all the more reason why creating a great infographic can sometimes be challenging.
But don't worry - there are various tools to create and review infographics that can make the process easier and more efficient.
In this article, we'll explore some of the best online tools for creating and reviewing infographics, along with their pros and cons.
Let's begin!
Why are infographics important for creative marketing?
Infographics are a cool asset, especially for marketers and creatives, to plan content and distribution.
Here's why:
Infographics are an excellent way to communicate information visually. With eye-catching infographics, readers can easily understand complicated data. This is because infographics make complex data digestible. This is an ideal way to grab people's attention and keep them engaged.
Plus, they're shareable via infographic makers!
When you create an informative and visually appealing infographic, people are likelier to share it on social media. This can effectively help spread the word about your brand or product.
Another great thing about infographics is that they can help establish your brand as an expert. Presenting data and insights clearly and concisely can help you position yourself as a knowledgeable source of information.
5 types of infographics
Infographics are a fun and creative way to present information and can be used for various purposes.
Here are some of the most common types of infographics:
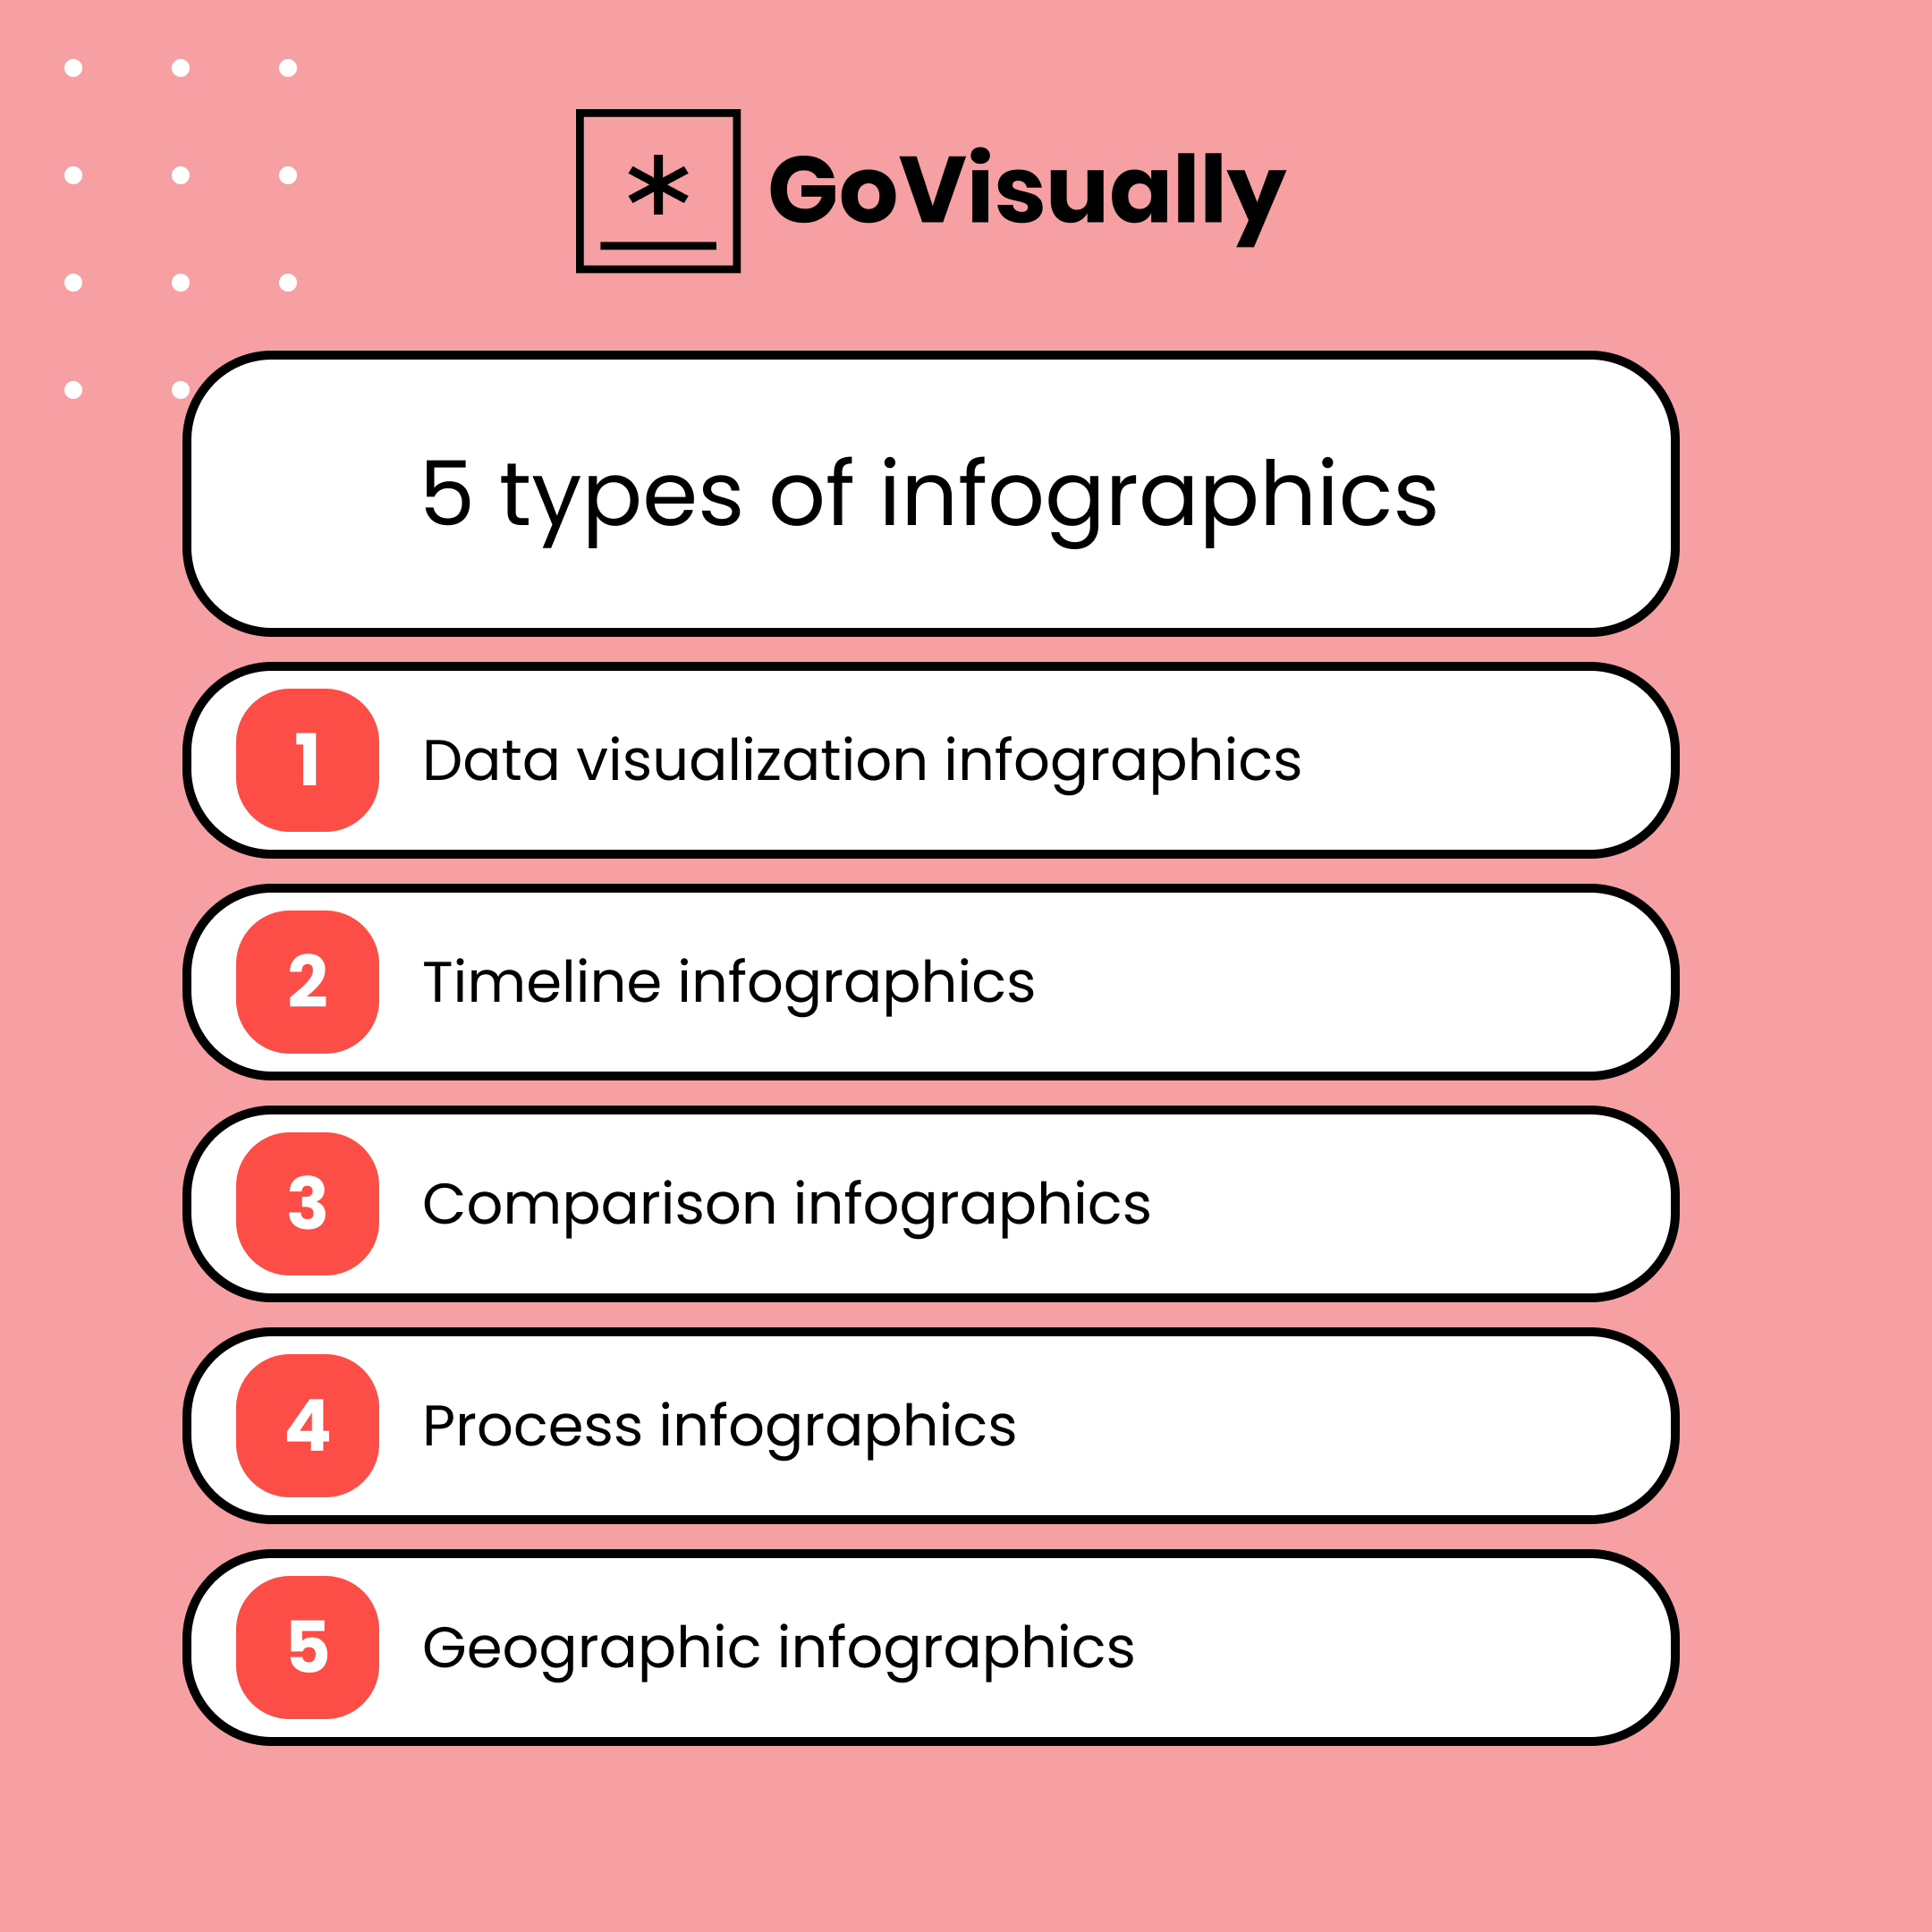
1. Data visualization infographics
These infographics are perfect for presenting complex data sets in an easy-to-understand way. For this purpose, charts, graphs, and other visual elements are employed. These elements make the data less confusing and help people quickly understand it. You may use these infographics to display survey findings, business statistics, etc.
2. Timeline infographics
As the name suggests, these infographics use a timeline format to present information. They can be used to display a company's, a product's, or an industry's history. Timeline infographics are an effective storytelling method as they intrigue your audience's attention.
3. Comparison infographics
The purpose of these infographics is to compare two or more objects. They are excellent for highlighting variations between goods, services, or ideas. Charts and diagrams are frequently used in comparison infographics to display information clearly and concisely.
4. Process infographics
Process infographics are used to explain a process or a system. For this purpose, flowcharts, diagrams, and other visual aids are used to make complicated systems or processes easier to understand. These infographics are excellent for outlining processes or providing step-by-step instructions.
5. Geographic infographics
If you're presenting location-based information, geographic infographics can be a great option. These infographics understandably provide information by utilizing maps and other visual components. They can display sales figures, demographic information, and much more.
7 tools to create infographics
Here's a list of the best infographic makers to create a visually appealing infographic!
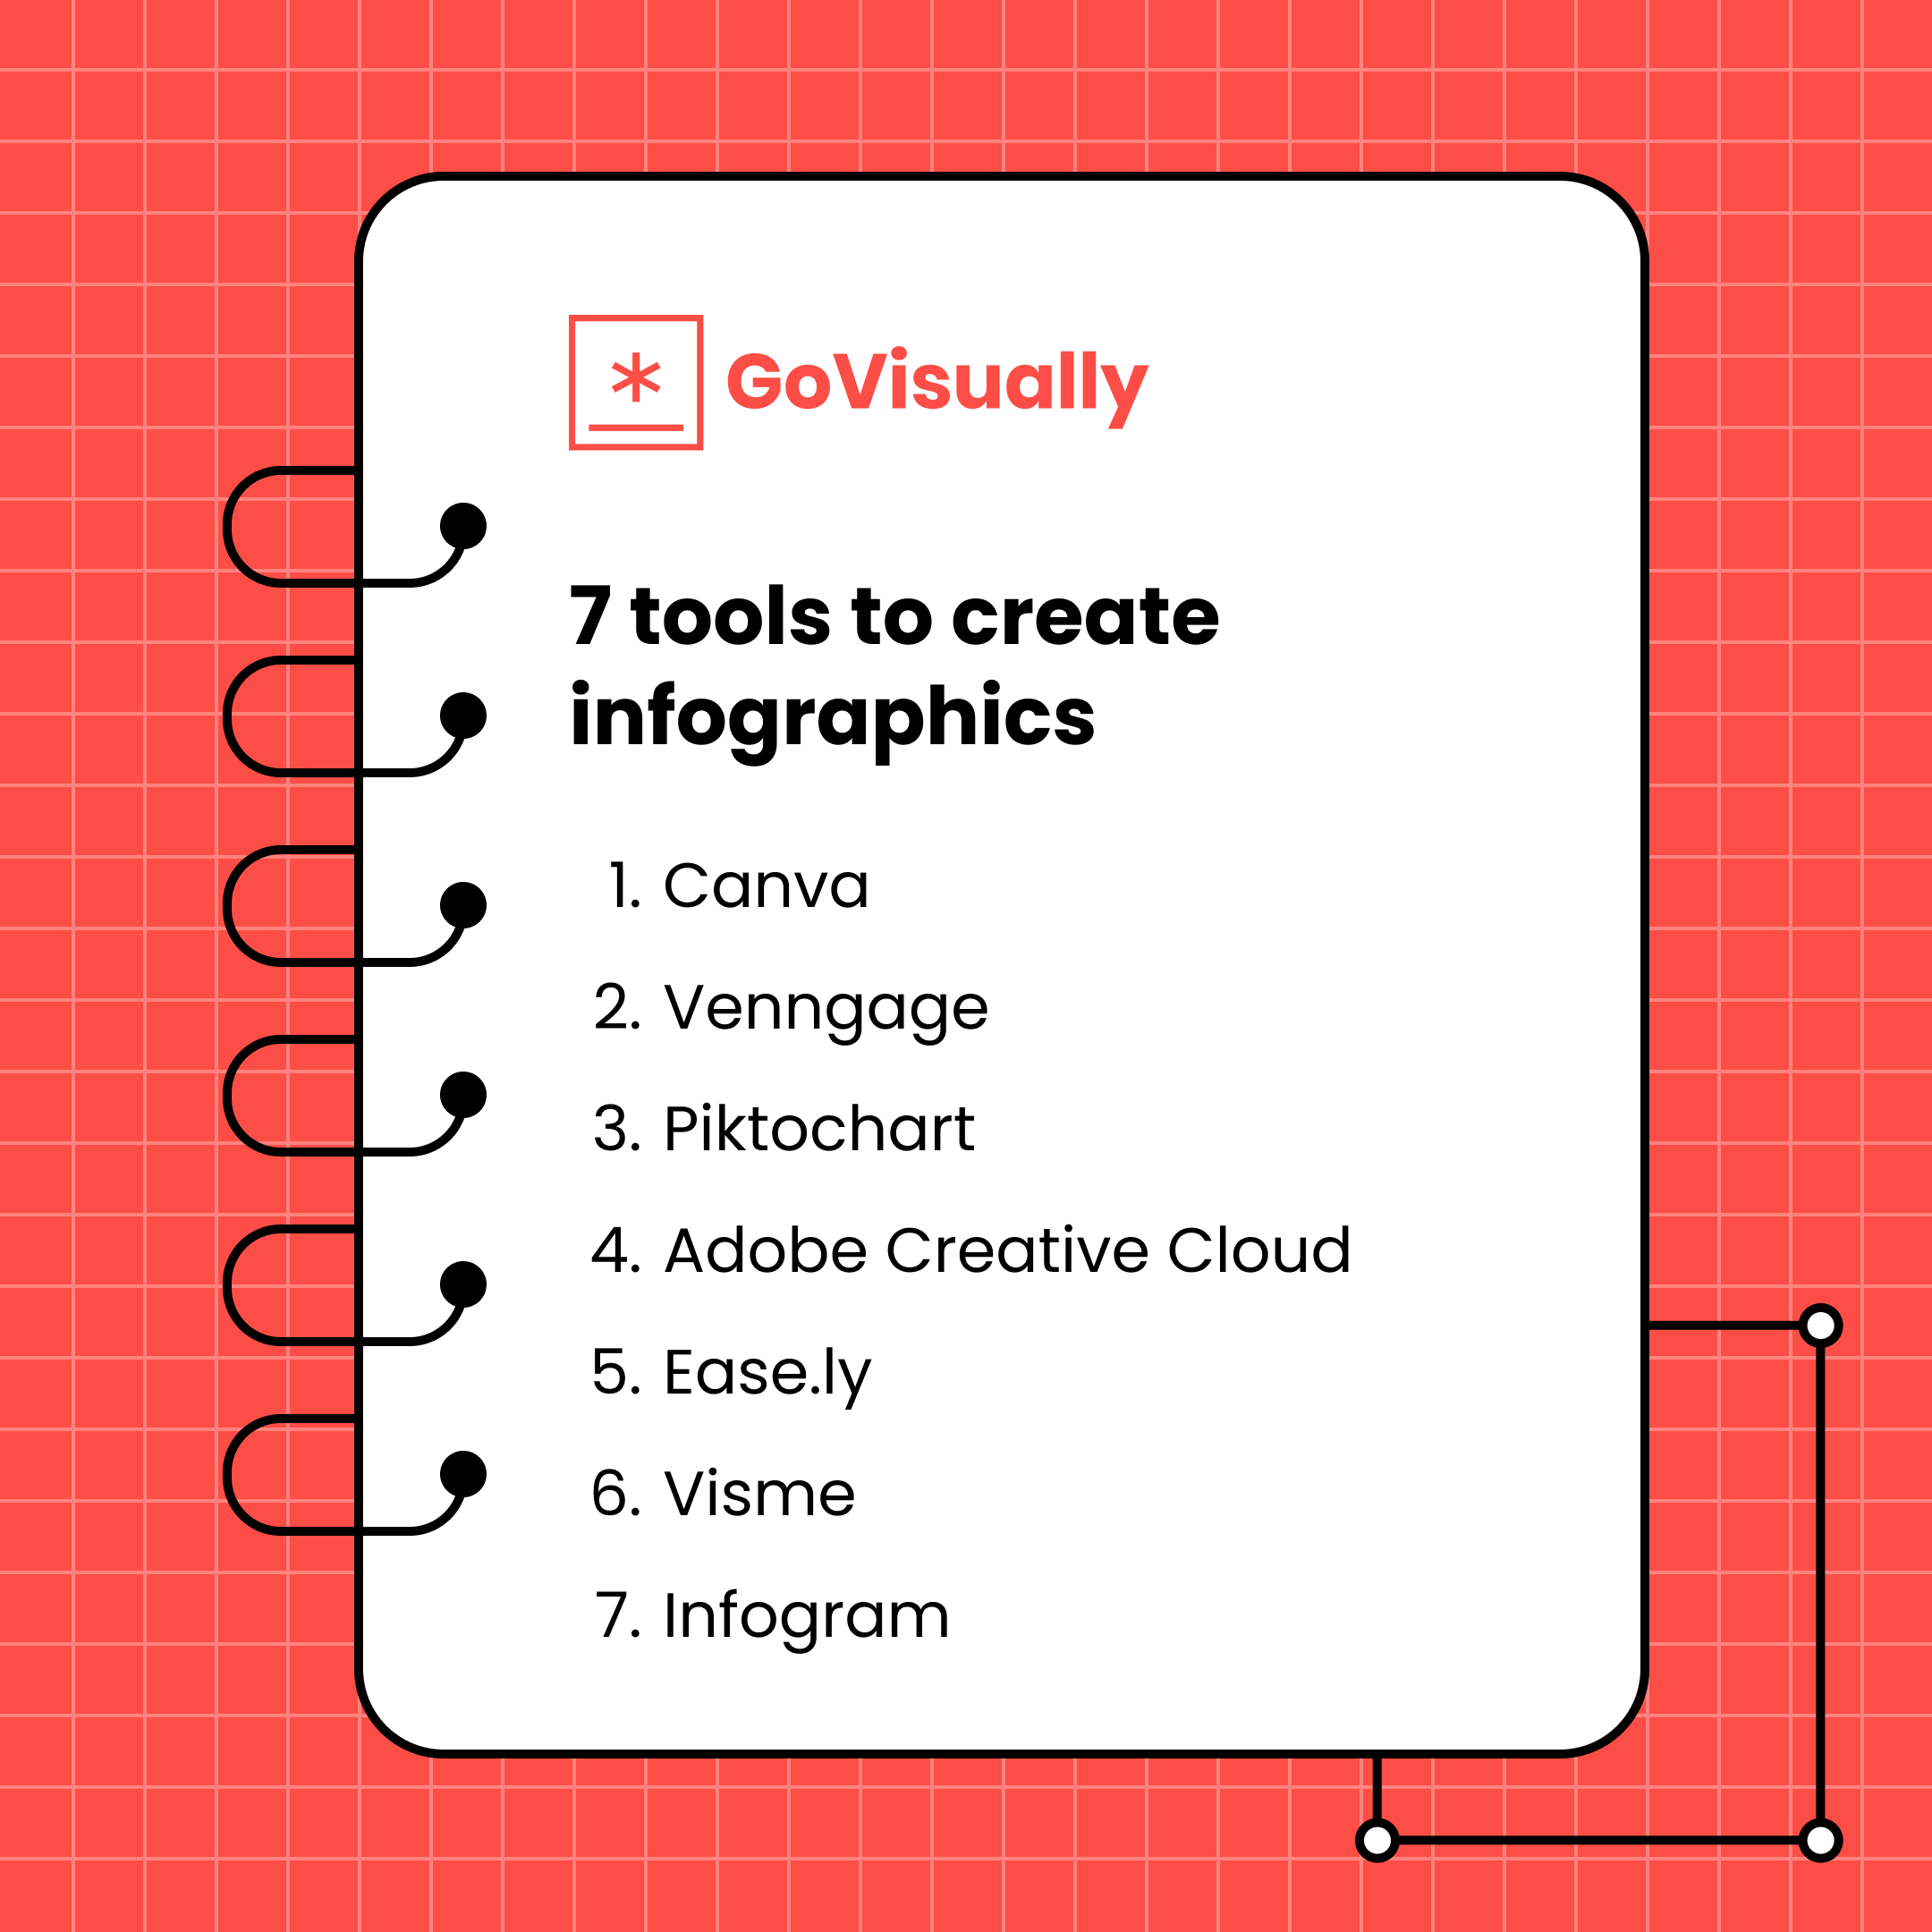
1. Canva
Canva is an amazing choice for modern infographics. It's undoubtedly one of the best infographic makers online for free. It has a user-friendly interface and offers a selection of 53 free infographic templates across different industries, including business, social services, education, and more.
Canva is an excellent AI-based infographics tool that can be used to create content for social media platforms like Facebook, Twitter, Instagram, or any other social media post.
Pros
- Collaboration with others through email sharing
- Provides thousands of images for projects and 2 million more for a monthly fee
- Offers charts, frames, color customization, illustrations, and icons in the free plan
- Provides extra fonts, special animations, organization tools, transparent backgrounds, and resizing capabilities in the paid plan
Cons
- Some premium elements require a monthly subscription
- Limited customization options in the free plan
- Some premium elements can be expensive
2. Venngage
Venngageis a comprehensive infographic creator with hundreds of photos, templates, icons, and charts. It's best suited for marketers looking to create infographics for external communication.
Although its search engine could improve, and it can be difficult to find the right image for your project, Venngage makes up for these minor shortcomings with user-friendliness and ease of use.
Pros
- 7500+ templates, 100 image uploads, and 40,000+ illustrations, charts, and icons
- Work on designs as a team with real-time collaboration
- Provides templates for reports, posters, promotions, and infographics
- Widgets based on specific info and data you have for your infographic
Cons
- Free members cannot download their designs
- A limited number of image uploads in the free plan
- The pricing can be expensive for individuals or small businesses
3. Piktochart
If you are looking for an infographic tool offering a wide range of templates, designs, and customization options, Piktochart might be the perfect fit.
Here are the pros and cons of using Piktochart:
Pros
- Six hundred highly customizable and professional-looking templates, infographic layouts, maps, and interactive charts in both Free and Pro plans.
- There is plenty of storage to upload your content, photos, custom visuals, marketing materials, multiple download formats, and collaboration options.
- Drag-and-drop interface
- You can create different types of infographics, including traditional infographic sizes, presentation sizes, posters, and reports.
Cons
- Piktochart does not offer advanced chart-making options. This might be a deal-breaker if you need to include complex data visualizations in your infographics.
- Some of the best templates are only available in the Pro plan, which means you might need to pay to access them.
4. Adobe Creative Cloud
Adobe Creative Cloud is a popular suite of creative software tools professionals use worldwide. It allows you to design infographics from mobile and desktop devices without graphic design experience and resize them for social media.
Pros
- There are various images, icons, fonts, layouts, colors, and editing options to realize your imagination. It comes in both free and premium plans.
- It has over 10,000 templates and thousands of free license-free assets to smarten your design.
- Creative Cloud Express uses a drag-and-drop editor, which is super simple to use.
Cons
- It might not be suitable for beginners or casual users. This means you need to be tech-savvy to understand many features.
- The free version has limited features, so you might need to pay for the premium plan to access more options.
5. Easel.ly
Easel.ly is an infographic maker perfect for those who want a simple, easy-to-use interface. It has a variety of pre-made templates to choose from and allows you to customize your infographic with text, shapes, and icons.
With Easel.ly, you can create charts and graphs to make your infographic more informative. However, Easel.ly has fewer features than other infographic makers. Therefore, creating more complex designs with Easel.ly cannot be easy.
Pros
- Simple, easy-to-use, and user-friendly interface
- A library of pre-made templates is available
- Allows for customization with the help of text, shapes, and icons
- Can create charts and graphs
Cons
- Easel.ly has limited features compared to other infographic makers
- Due to a lack of features, it can be not easy to create more complex designs
6. Visme
Vismeis an infographic maker perfect for those who want more control over their designs. It has many templates and allows you to create custom designs.
With Visme, you can add various elements to your infographic, including text, images, videos, and audio.
Visme also has a built-in analytics tool that allows you to track the performance of your infographic. However, Visme can be overwhelming for beginners, and its pricing structure can be expensive for some users.
Pros
- A wide range of templates is available
- Allows for custom designs
- Can add text, images, videos, and audio to your infographic
- Built-in analytics tool to track the performance of your infographic.
Cons
- It can be overwhelming for beginners
- The pricing structure can be expensive for some users
7. Infogram
Infogramis one of the best infographic makers. It is perfect for those who want to create interactive infographics. Infogram has a variety of templates to choose from and allows you to add text, images, and charts to your design.
With Infogram, you can create interactive maps, timelines, and graphs to make your infographic more engaging.
However, Infogram can be difficult for those unfamiliar with design software, and its pricing structure can be quite heavy on the pockets of individual designers.
Pros
- A variety of pre-built templates are available
- Can create interactive maps, timelines, and graphs
- Allows for customization with text and images
- Can add charts to your design
Cons
- The application can be difficult to use for those who are not familiar with design software.
- The pricing structure can be expensive for some users.
How to give feedback on infographics?
Feedback is an important part of creative design. But, giving feedback on infographics can be tricky, especially if you're not a designer.
Here are a few simple tips to review infographics easily.
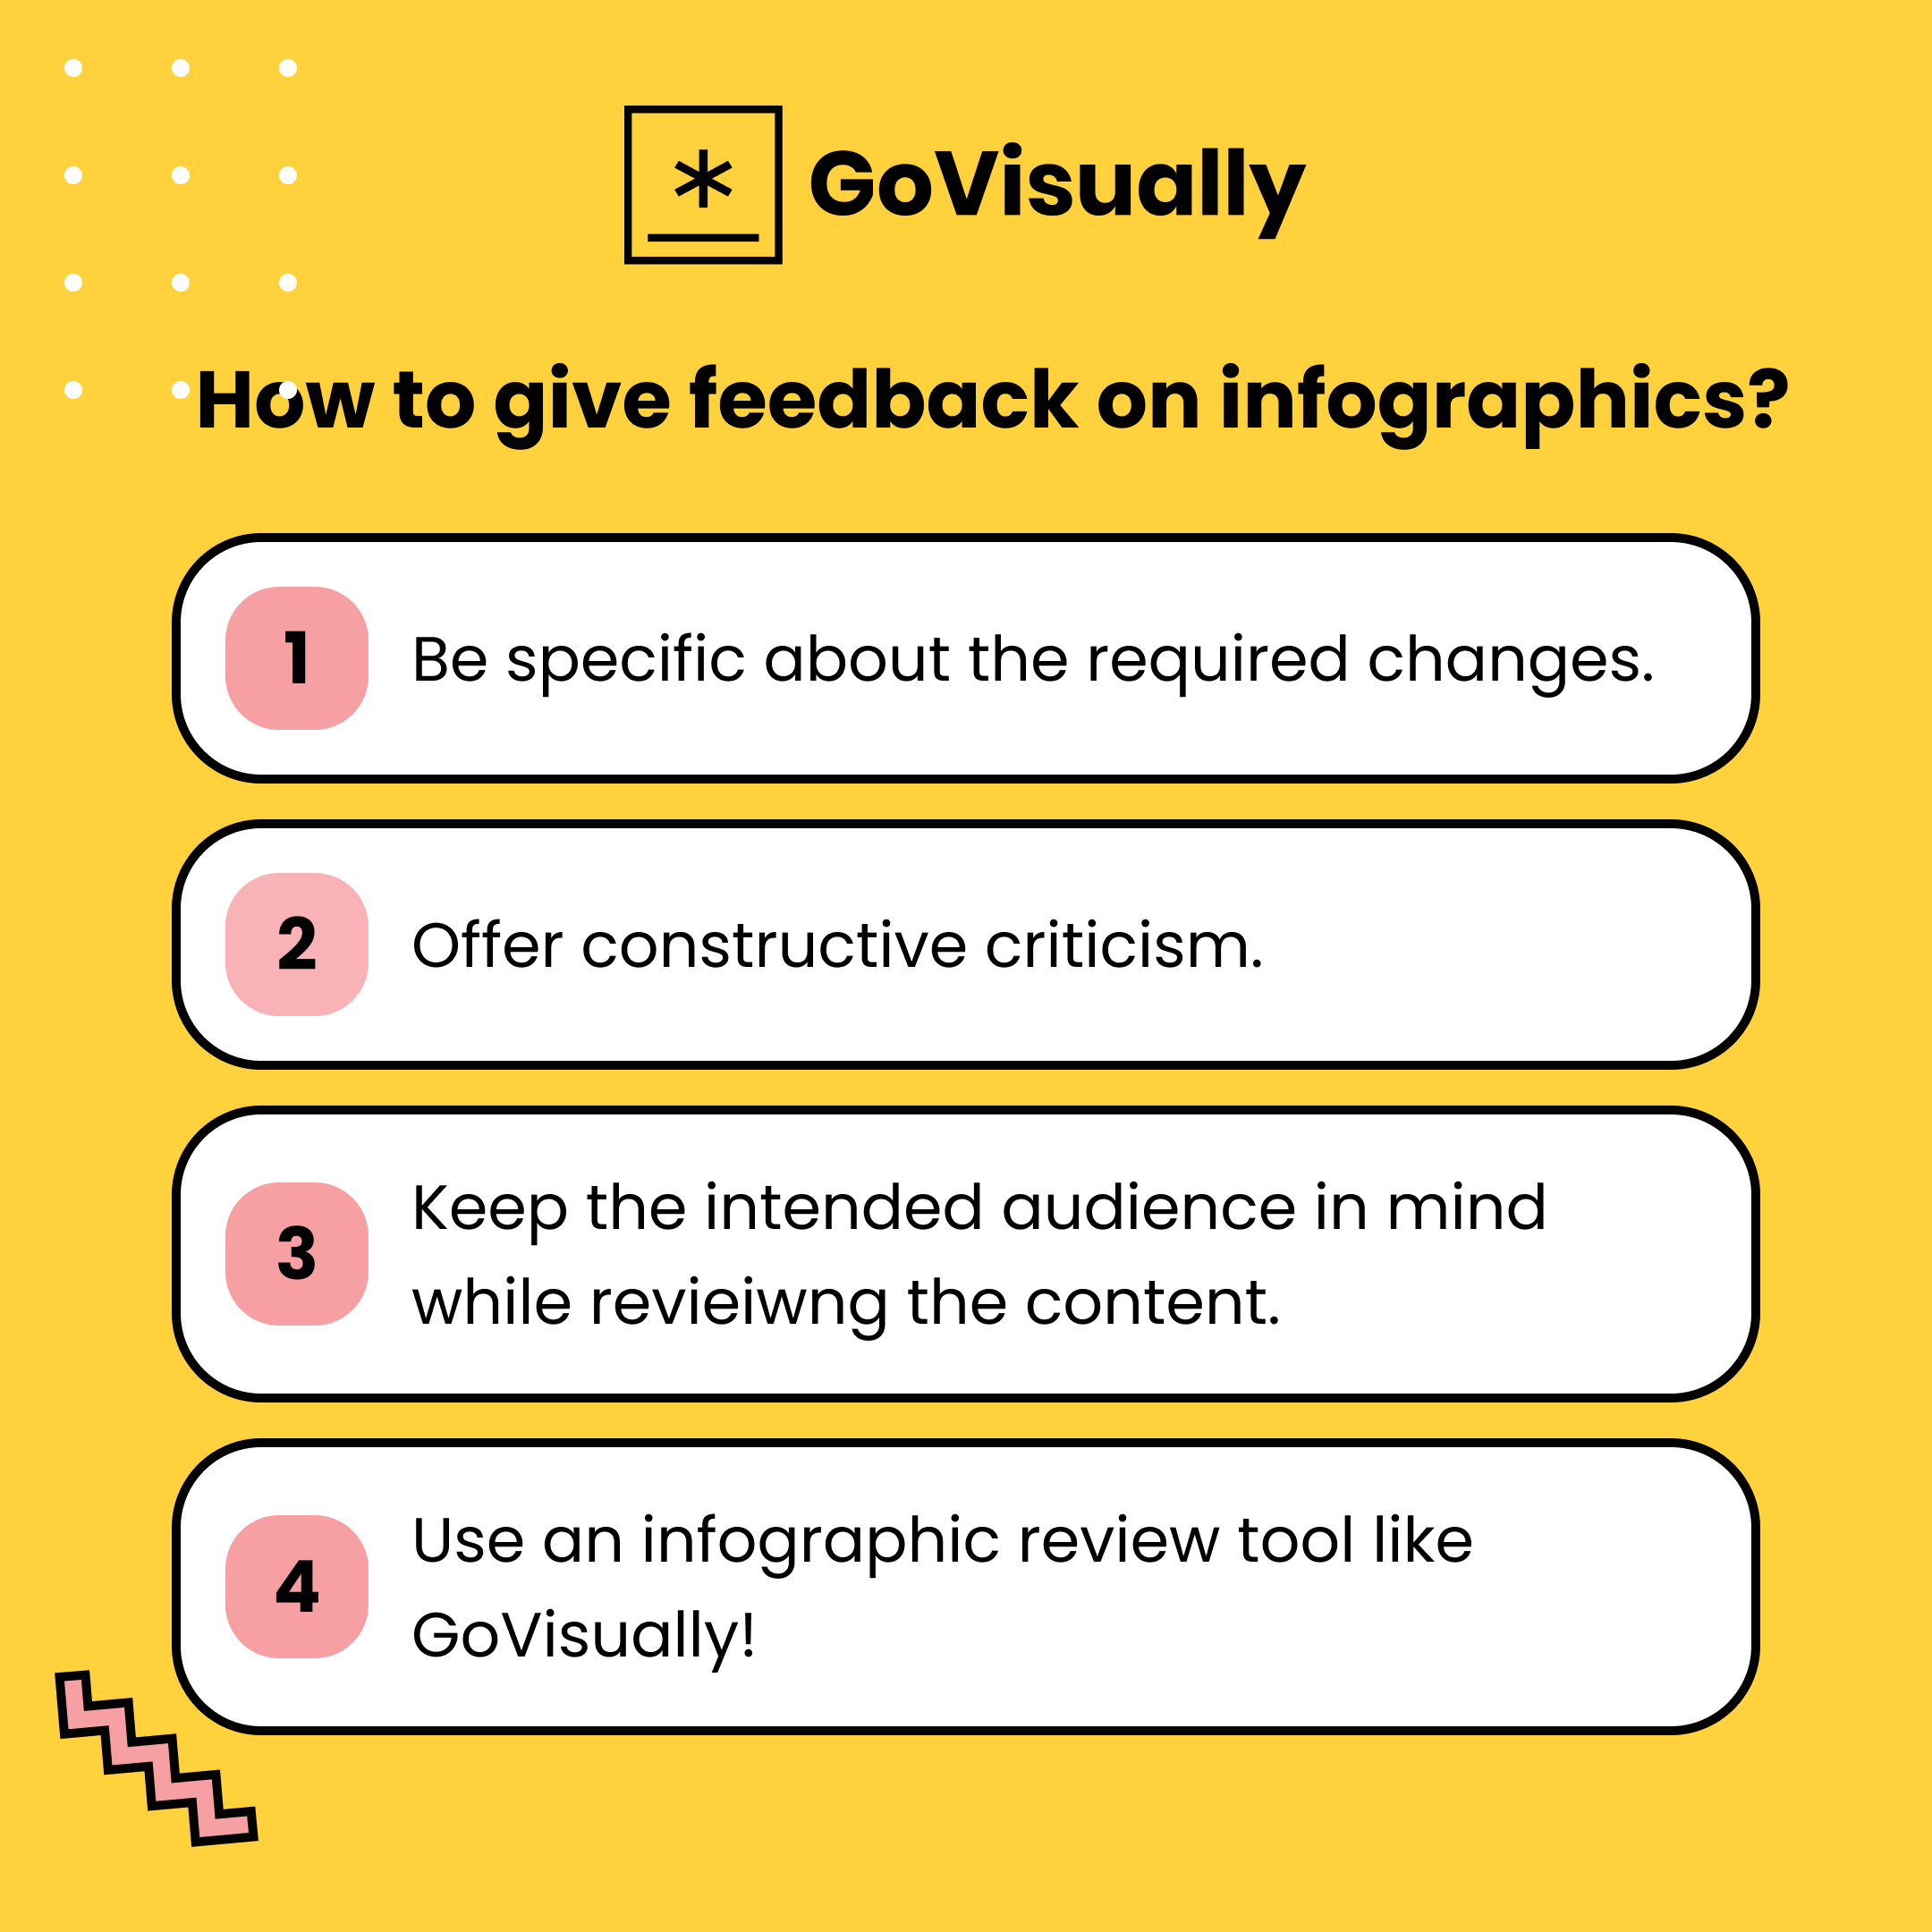
- Be specific about what you like and don't like. Rather than saying, "I don't like this infographic," try to identify what elements you find unappealing. This will help the designer understand what changes to make.
- Be constructive in your feedback. Instead of just pointing out flaws, suggest ways to improve the infographic.
- Keep in mind the intended audience and purpose of the infographic. Does the design effectively communicate the information to the intended audience? Does it serve its intended purpose?
Luckily, several tools can make receiving feedback on your infographics easy and streamline the approval process.
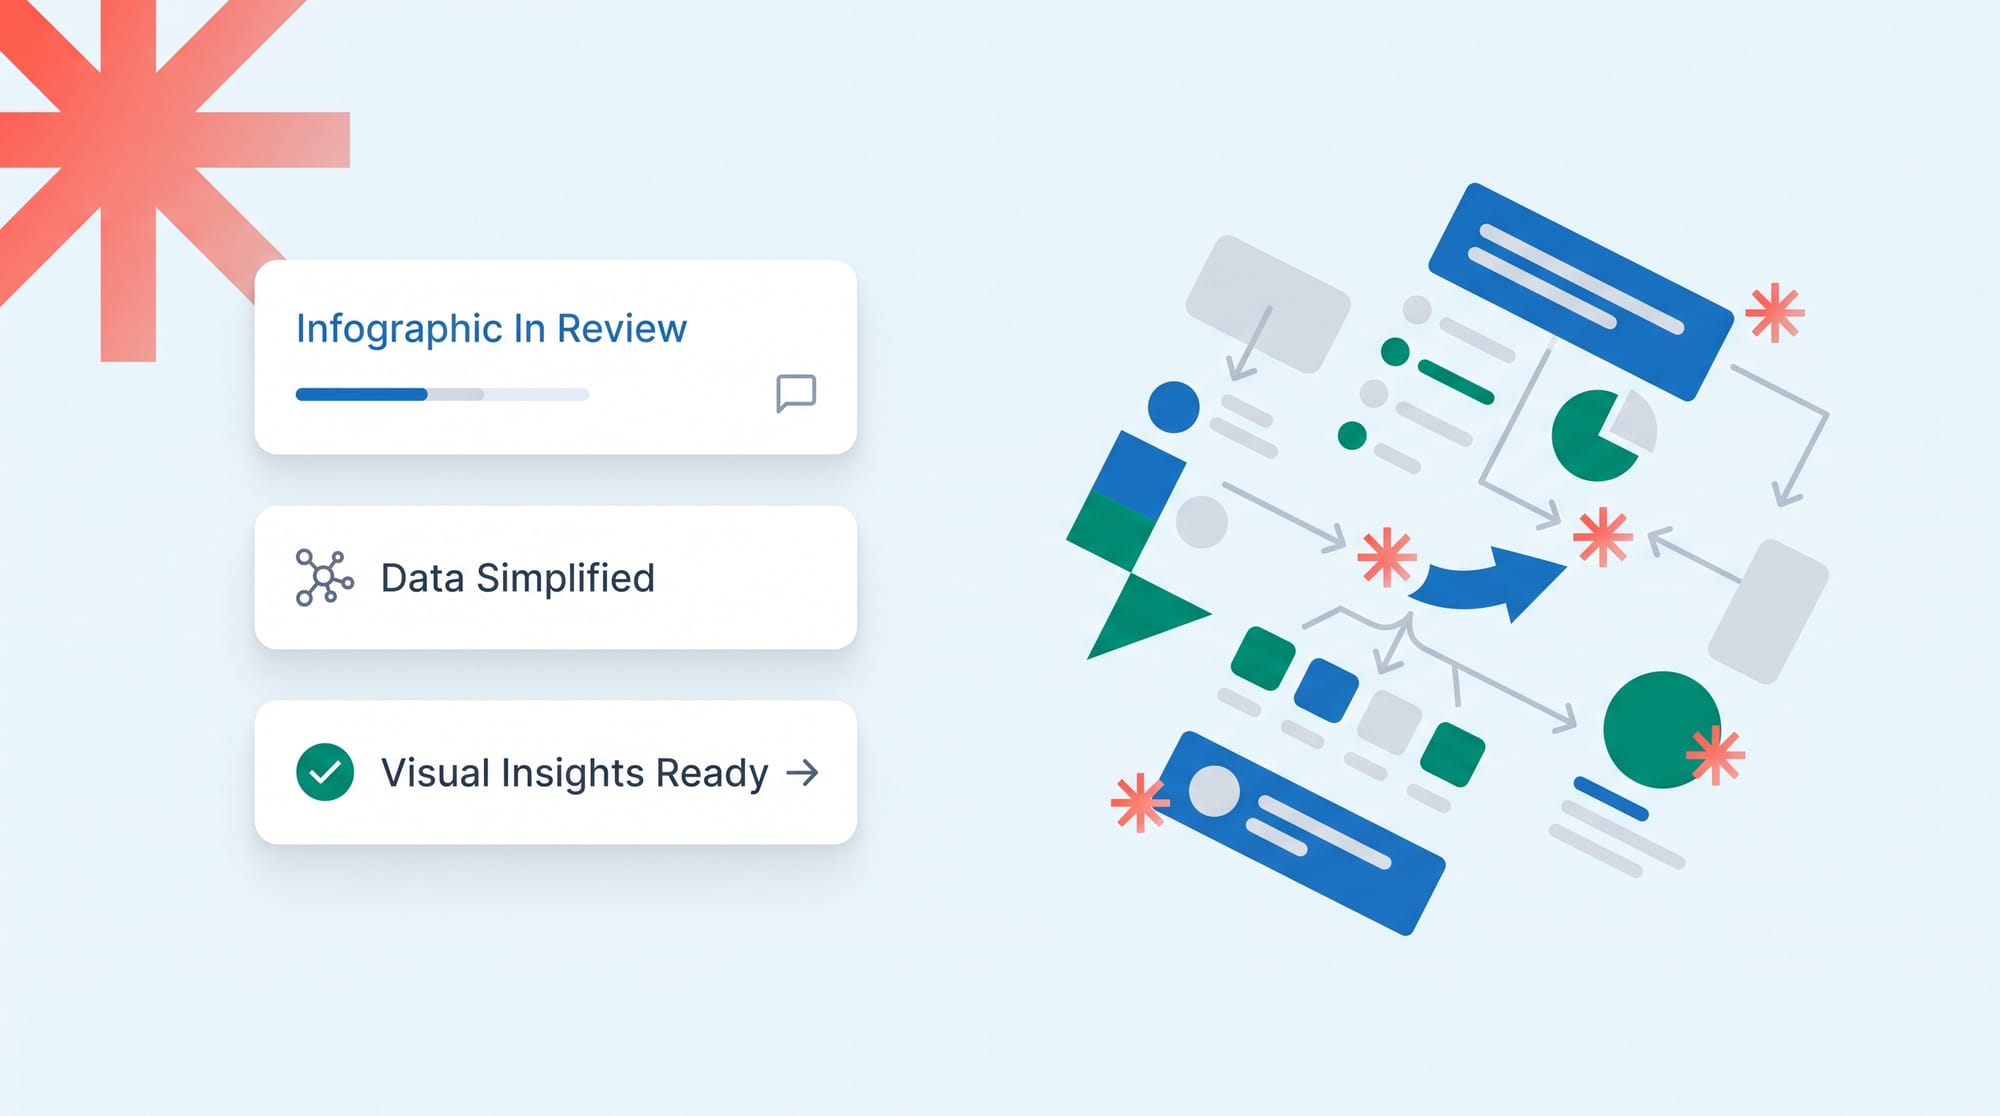
GoVisually
If you're working with a team or designer, tools like GoVisually can be incredibly helpful for giving and receiving feedback.
GoVisually allows for real-time collaboration and annotation on designs, making providing clear and specific feedback easy. Using a tool like GoVisually, you can streamline the feedback process and ensure everyone is on the same page regarding revisions and changes.
5 features make GoVisually the best to review infographics in under 30 minutes or less!
GoVisually is one of the most trusted infographic review tools for anyone looking to review and approve infographics quickly and easily.
Here are the 5 GoVisually features our customers love, and so will you!
1. Facilitates a streamlined feedback process
GoVisually allows unlimited reviewers to provide feedback and approval through a free, easy sign-in process. This feature ensures that everyone involved in the project can easily access and provide feedback, making the feedback process more efficient.
2. Organized revisions and track changes
With GoVisually, users can organize multiple revisions of their designs in one space, categorized and labeled for easy identification. This feature ensures that reviewers are looking at the correct version of the infographic, making the review process faster.
3. Collaboration made easy
GoVisually simplifies the review process by providing a clean interface where all projects and feedback are in one place. This feature ensures reviewers don't miss client feedback and allows team members to collaborate seamlessly.
4. Supports multiple formats
GoVisually supports many file formats, including PDF, JPEG, PNG, video, GIF, and more. This makes it easy to upload and review infographics created by various design tools. You can also easily use GoVisually as an infographic maker video feedback tool.
5. Clear annotations tools for quick feedback
The platform offers an intuitive annotation tool that makes it easy to provide clear and concise feedback on specific infographic elements. You can add comments, draw attention to particular sections, or even directly change the image.
Final thoughts
You'll find several paid and free options to create and review infographics.
Whether a beginner or a professional, these tools will help you create and review infographics from scratch in only 30 minutes!
And remember - half the power of a great infographic lies in its authenticity. So ensure you review the content and branding elements properly before finalizing.
If you're looking for an application offering a user-friendly solution to review infographics, don't forget to sign up for a trial with GoVisually.