6 Ways Project Management Charts Help Create a Successful Workflow
For project managers to do their job successfully, they need to have an organized schedule and a clear plan of everything that needs to be done. Recent data and statistics regarding project management have shown that 11.4% of a project's resources get wasted if the management is low-quality, outdated, and disorganized.
So, to ensure that the risk of project failure is as low as possible, a company must use a brilliant and engaging project management strategy.
Enters project management charts.
It is one of the essential tools for a project manager that helps with workflow using is data visualization tools.
And today, we're going to discuss the 6 important ways these charts can help you create an effective workflow. Let's start!
[elementor-template id="3538"]
What is a project management chart?
All the data related to a project can be visually depicted in a project management chart. It makes the data easier to read and interpret. The project data and statistics in a chart can make it more accessible and easier to use.
Project management charts enable the project manager to gain insight into a project's progress and plan tasks accordingly. A project management chart contains information that is critical to the project. Deadlines, resources, task details, milestones, and much more are presented in these charts.
Project managers use project management charts to analyze the data and make informed decisions regarding future tasks related to the project. These charts are incredibly versatile and can track various aspects of a project. It is the project manager's job to create these charts and tailor them to the requirements of a project.
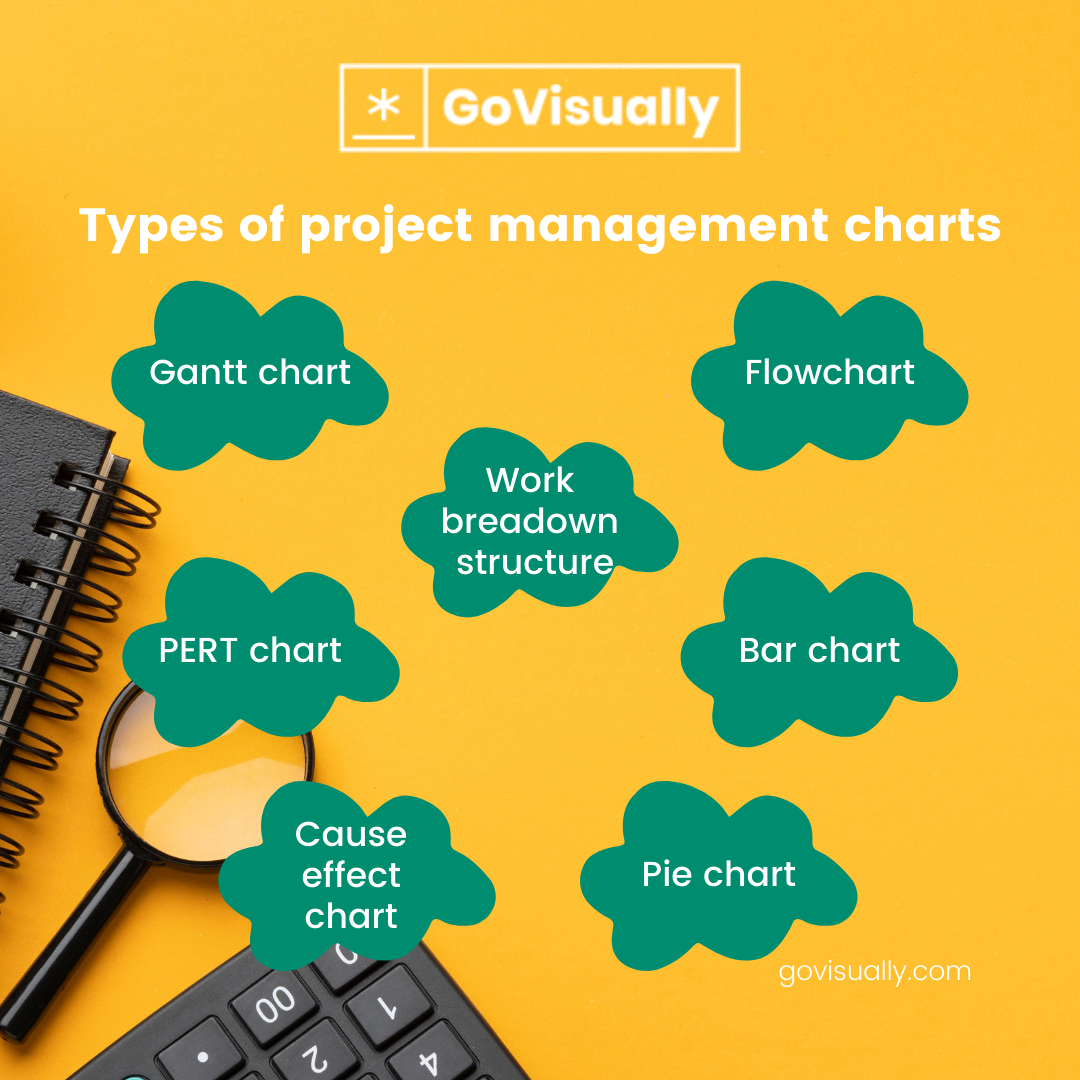
Types of project management charts
1. Gantt chart
Gantt charts in project management are the most prominent. Almost all business and project managers use these charts to organize their projects. Gantt charts are so popular because they provide a timeline view of the project, making it easier to visualize all the tasks and how they fit into the entire project's timeline.

(source: project manager)
A Gantt chart is a variation of the bar chart. The vertical axis of a Gantt chart shows you the project's tasks, and the horizontal axis represents the time duration for the tasks. These charts are easy to interpret and understand.
2. Work breakdown structure
Having an organized system to divide the project into more manageable sections can help project managers. Work breakdown structure can help with doing just that. Generally, the Work breakdown structure (WBS) has level 1, containing all the project's main tasks.
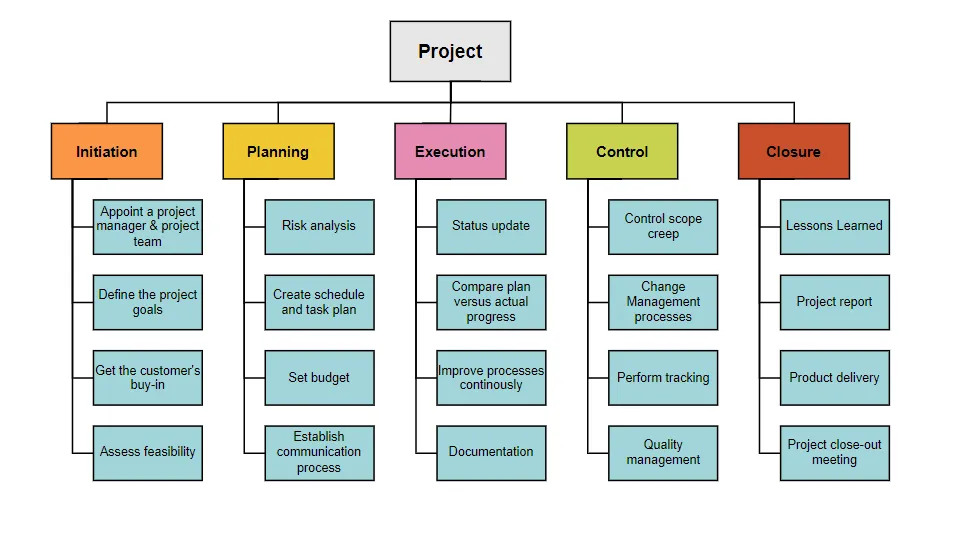
(source: conceptdraw)
All the tasks in level 1 are further divided into sub-tasks and listed below the main task. The WBS can help streamline and organize your projects. It may not contain any stats or figures, but it can still make a project manager's job significantly easier. This project management chart provides managers with a way to simplify complex tasks and manage them better.
3. PERT chart
Program Evaluation and Review Technique (PERT) is one of the most commonly used project management tactics. It is used in a wide range of industries. PERT charts for project management are viral. These charts help control, schedule, and monitor a project's tasks.
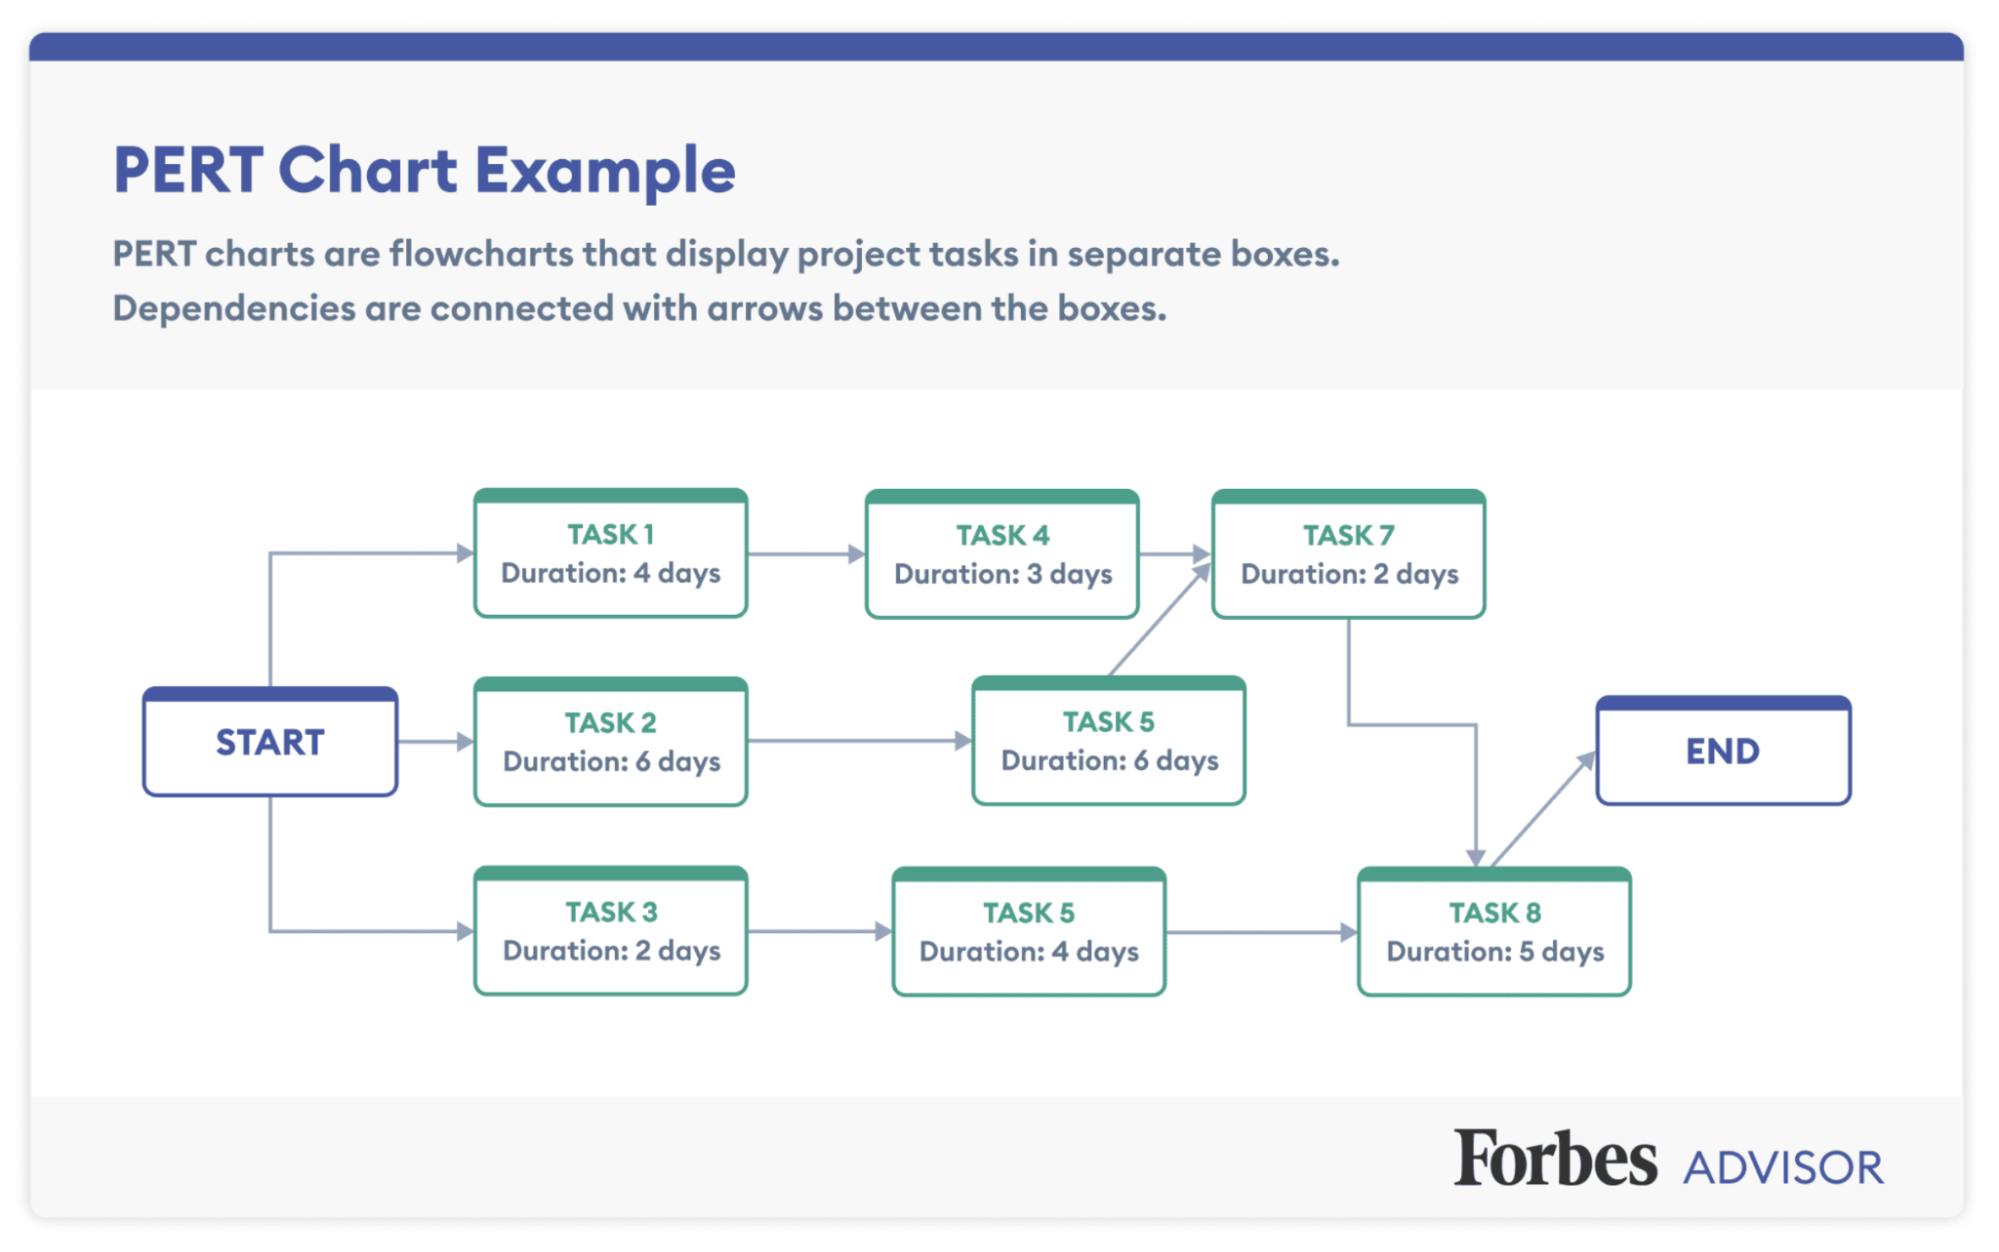
(source: forbes)
PERT charts show the milestones and activities in a network diagram. A general PERT chart contains circles and arrows. The circles depict the project activity, and the arrows indicate the progression of the activity. This project management chart also lets you know which activities can be completed simultaneously and makes the process more efficient.
4. Flowchart
Most projects have many activities, and the flow gets too complex to manage. Project management flowcharts can make it easy for project managers to keep the activities streamlined. A project management flowchart is the graphical representation of the workflow for a project.
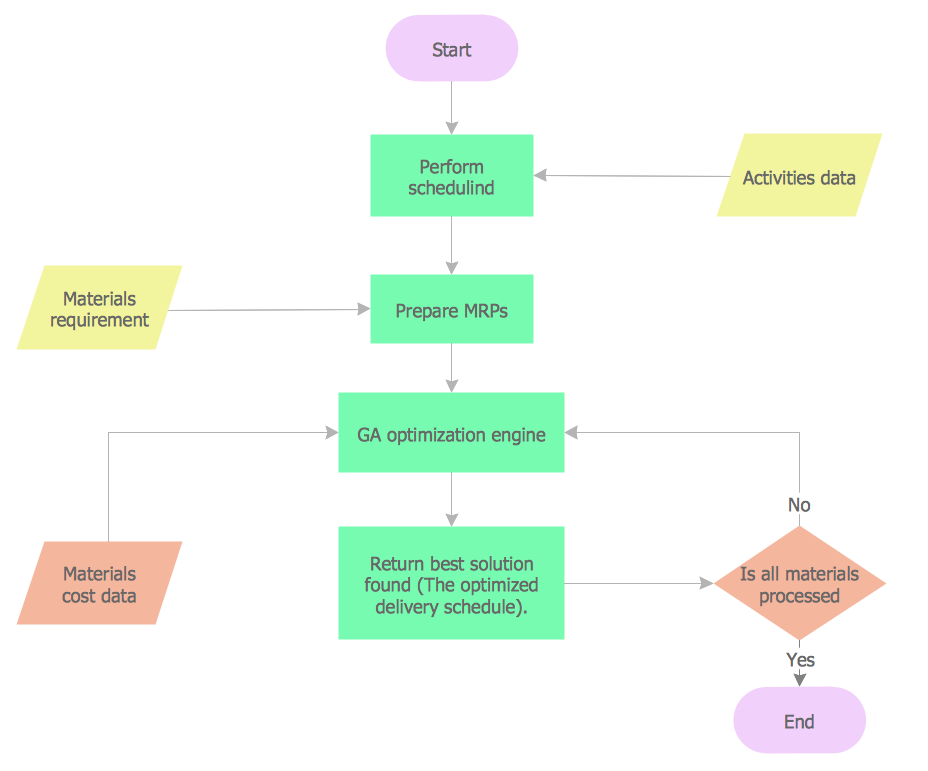
(source: conceptdraw)
A flowchart contains all the processes and activities from the start till the end of a project. These charts use various boxes and figures to show the sequence of events during a project and how these events are connected. You can use a flowchart to determine the logic of your project and share it with other stakeholders and team members.
5. Bar chart
Bar charts in project management are easy to use and interpret, making them popular. They are versatile and straightforward project management charts, and managers use them to visualize a wide range of data related to the project. As a project manager, you have to keep track of things like the time distribution of your team members and the tasks they are completing.
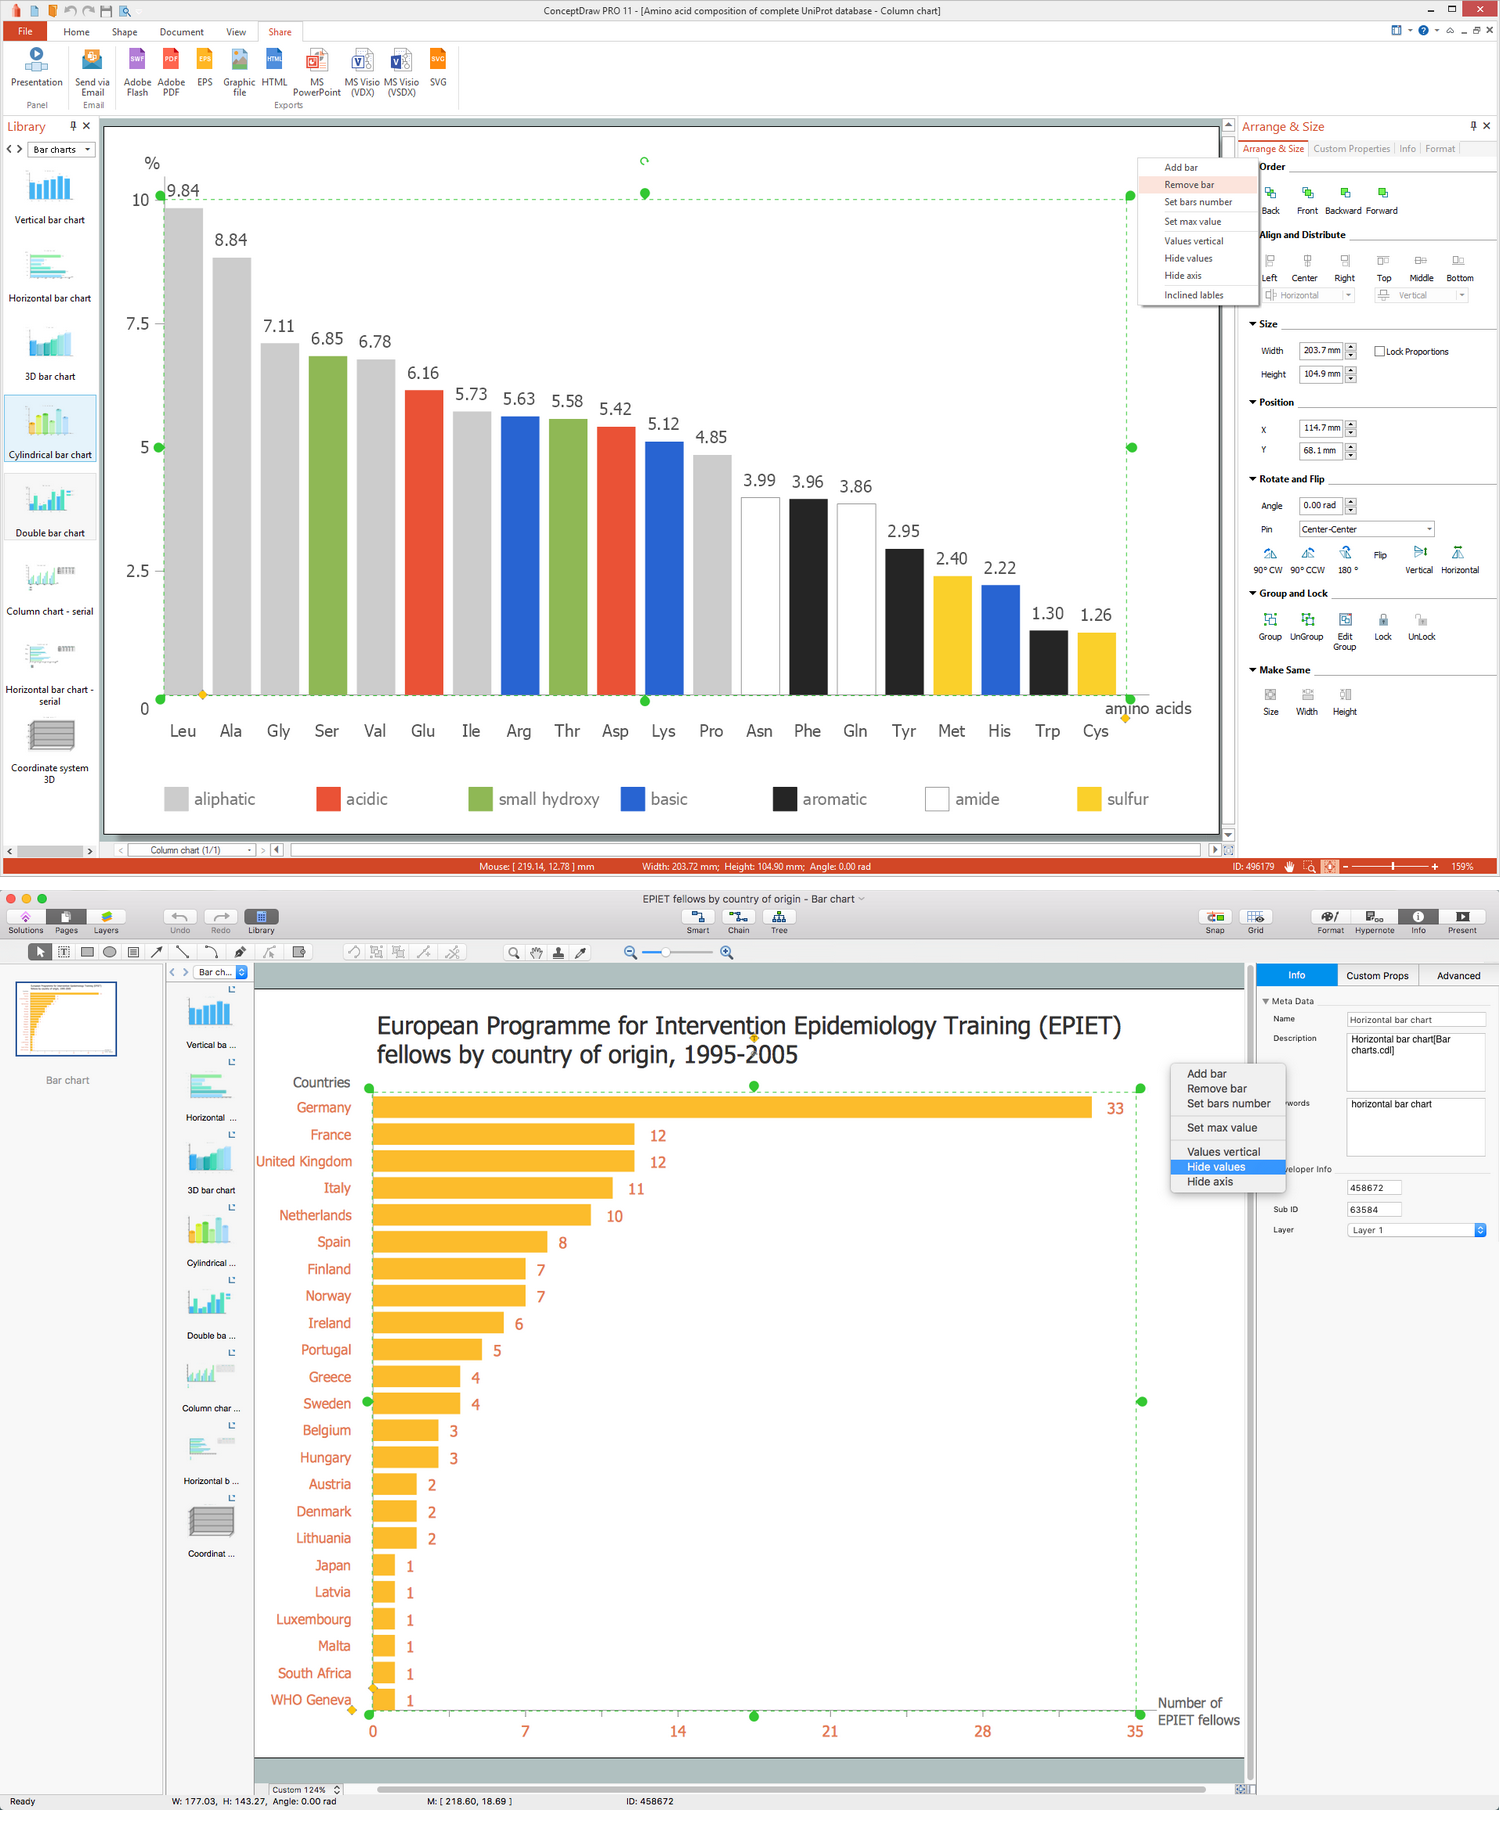
(source: conceptdraw)
Bar charts enable project managers to access this data efficiently and quickly. Most project management tools and software use bar charts to show you various aspects of your project and modify these charts as the project makes progress.
6. Pie chart
Pie charts are one of the most detailed and widely-used project management charts. These charts are versatile, like the bar charts, and can display various information and data. Pie charts are circular and the perfect option for data segmentation.
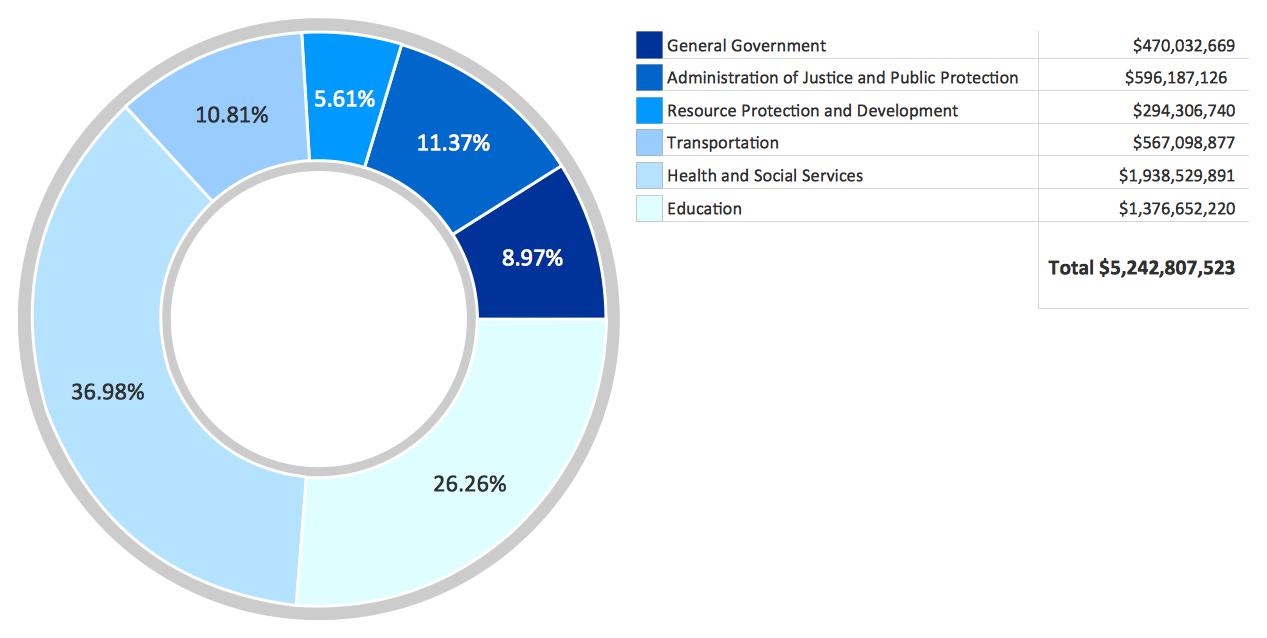
(source: conceptdraw)
Pie charts depict numeric proportions of the different portions that form a whole. You can use a pie chart for data visualization regardless of the level of complexity of your project. Using pie charts for more than ten categories can make the chart cluttered, which is the only drawback of these valuable and straightforward project management charts.
Cause-effect chart
As a project manager, it is part of your key responsibilities to identify any problems and solve them immediately. Project managers need to figure out the cause of all of the issues they face. Using a cause-effect chart enables the project manager to highlight all the potential reasons for a problem.
A cause-effect chart contains all the causes of problems faced during the project timespan and their effects on the project. You can use cause-effect charts to analyze the issues you meet with your project thoroughly. These project management charts are straightforward to use and understand.
6 ways project management charts can help your workflow
Using excellent project management tools and techniques can help you decrease the risk of failure.
Project management charts are a powerful weapon in every project manager's arsenal. These charts can help streamline the workflow and keep all activities under check.
Let's have a look at some of these benefits.
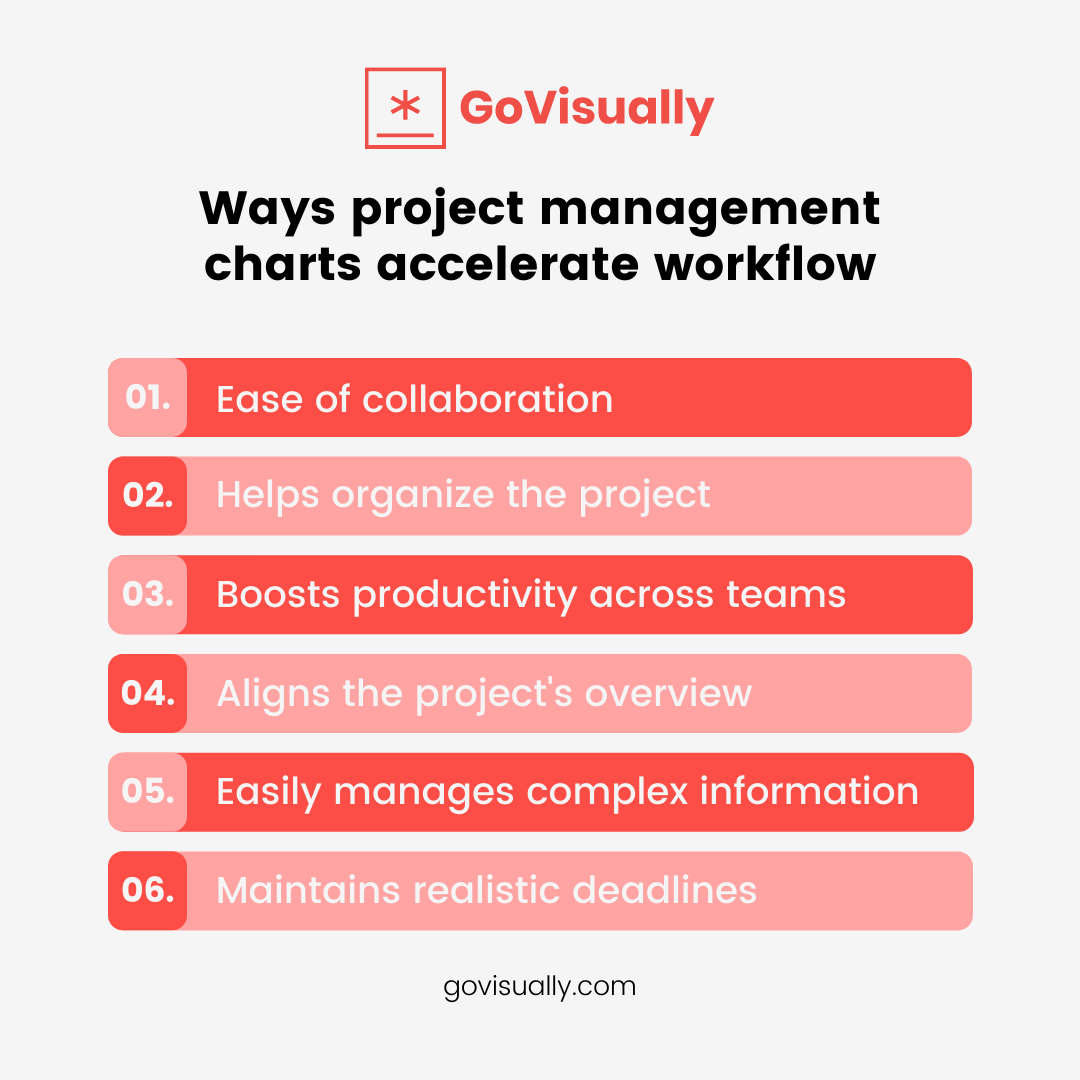
1. Ease of collaboration
Project management charts make it easier for you to carry out collaborative projects. These charts are a brilliant way of staying up to date with the activities of each member. You can use project management charts to track each stakeholder's progress and how much progress has been made.
Collaborations can cause a lot of confusion, which can lead to delays. Using project management charts can avoid errors and correct any made. These charts are the best way for all team members to stay on track and all parties participating in the collaboration to stay on the same page.
2. Organizing the project
The most crucial part of a project manager's job is organizing every task. Project management charts help you plan every step meticulously. With the help of these charts, you can create a clear workflow and manage timelines with ease. Project management charts can help provide clarity for all members of the team.
Incorporating project management charts into your workflow enables you to track every task from the start of the project till the end.
3. Boost productivity
These charts enable all team members to work together and increase productivity. As mentioned above, these charts make collaborations more accessible and more straightforward. Workers can come together to provide high-quality results.
Project management charts also increase the sense of accountability for all team members. When everyone knows how well their tasks and progress are tracked, they will meet deadlines and work more efficiently. The transparency ensures that everyone remains focused on the tasks they need to complete.
4. Provides an overview of the project
One of the most crucial functions of project management charts is providing an overview of the entire project. If you use project management charts, you don't need to provide a separate project overview.
People in higher positions like the executives and other stakeholders are not a part of the entire process. These people don't follow the project closely and need to be provided with a high-level overview of everything. Project management charts can help provide this overview for them.
5. Manage complex information and data
Project management charts like bar charts, pie charts, Gantt charts, and more can help simplify complex data and information. With the help of these charts, you can understand this information better, and it becomes more useful for you. If you don't understand complicated information, you will not improve your project management.
Project management charts also provide you with a simplified outlook for all the tasks related to the project. It makes them more straightforward to comprehend. Team members who have to complete these tasks can understand them better by using the charts.
6. Maintain realistic deadlines
Often, we set deadlines and expectations for an unrealistic project. That is where project management charts can help you re-organize your goals. They provide you with an overview of all the tasks and milestones.
With the help of these charts, you can make informed decisions when it comes to deciding deadlines. Project management charts help you understand the timeline better, and you can ensure that your team members don't feel extra pressure when it comes to meeting deadlines.
[elementor-template id="9369"]